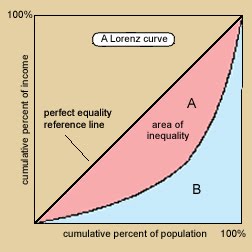
The accumulative line graph or Lorenz Curve graphically represents the cumulative representation the cumulative distribution function of a probability distribution. A Lorenz Curve is used to display income distribution. As you can see above on the accumulative line graph the vertical axes is income and the vertical axes is population.
http://images.google.com/imgres?imgurl=http://www.unc.edu/depts/econ/byrns_web/Art/Glossary/LorenzCurve.jpg&imgrefurl=http://mcatfordummies.blogspot.com/2008/08/accumulative-line-graph-or-lorenz-curve.html&usg=__1yoyIDakWk0DqwwjY_0pYRbLBWA=&h=252&w=252&sz=37&hl=en&start=3&um=1&itbs=1&tbnid=Hj-xgpS4uCWCIM:&tbnh=111&tbnw=111&prev=/images%3Fq%3Daccumulative%2Bline%2Bgraph%26um%3D1%26hl%3Den%26client%3Dsafari%26sa%3DN%26rls%3Den%26tbs%3Disch:1
No comments:
Post a Comment