Friday, April 23, 2010

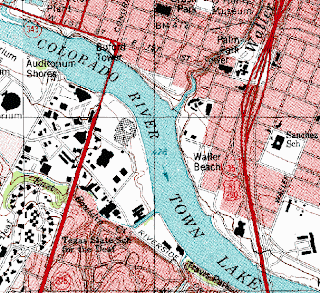
DRG


A digital raster graphic (DRG) is a scanned image of a US Geological Survey standard series topographic map.

http://images.google.com/imgres?imgurl=http://www.tceq.state.tx.us/assets/public/gis/images/drg.gif&imgrefurl=http://www.tceq.state.tx.us/gis/drg.html&usg=__qxjL45cP4iIaG2I7U_tRa1wO3Vs=&h=556&w=607&sz=97&hl=en&start=2&um=1&itbs=1&tbnid=XTr5fV2kfCeExM:&tbnh=125&tbnw=136&prev=/images%3Fq%3Ddrg%26um%3D1%26hl%3Den%26client%3Dsafari%26rls%3Den%26tbs%3Disch:1

DLG


A digital line graph (DLG) is a digital vector data representing cartographic information. DLG's contain a wide variety of information depicting geographic features.

http://images.google.com/imgres?imgurl=http://www.dnr.sc.gov/GIS/img/beaufdlg.gif&imgrefurl=http://www.dnr.sc.gov/GIS/descdlg.html&usg=__0pi5BhKiLauGk0s_nvNSQugOHzo=&h=257&w=288&sz=16&hl=en&start=2&um=1&itbs=1&tbnid=Q9saV3NDDRom1M:&tbnh=103&tbnw=115&prev=/images%3Fq%3Ddigital%2Bline%2Bgraph%26um%3D1%26hl%3Den%26client%3Dsafari%26rls%3Den%26tbs%3Disch:1

DEM


A digital elevation model (DEM) is a digital representation of ground surface topography or terrain. A DEM can can be represented as a raster or as a triangular irregular network.

http://images.google.com/imgres?imgurl=http://edc.usgs.gov/images/dem.jpg&imgrefurl=http://lukesmaps.blogspot.com/2008_12_01_archive.html&usg=__3ZngUOOz5PG3ARFDFZsy0lzrST4=&h=846&w=634&sz=204&hl=en&start=2&um=1&itbs=1&tbnid=Y0xo31nJCxFYSM:&tbnh=145&tbnw=109&prev=/images%3Fq%3DDEM%26um%3D1%26hl%3Den%26client%3Dsafari%26sa%3DN%26rls%3Den%26tbs%3Disch:1

DOQQ


Digital Orthophoto Quarter Quads (DOQQ) are digital images produced by the USGS. They contain orthorectified aerial photography at a resolution of 1 meter.

http://images.google.com/imgres?imgurl=http://www.dnr.sc.gov/GIS/images/doqq_ex2006.gif&imgrefurl=http://www.dnr.sc.gov/GIS/descdoqq.html&usg=__dKQ3_dTdeqqIO_rqbqh0yNzyHYI=&h=265&w=225&sz=63&hl=en&start=10&um=1&itbs=1&tbnid=Dt9RTZZd1OocJM:&tbnh=112&tbnw=95&prev=/images%3Fq%3DDOQQ%26um%3D1%26hl%3Den%26client%3Dsafari%26sa%3DN%26rls%3Den%26tbs%3Disch:1

Continuously Variable Proportional Circle Map


A continuous variable proportional circle map is a proportional circle map which utilizes circles to create point data. These circles on the maps are in proportion to the variable being measured. This continuous variable proportional circle map above shows where the major industries are located in western Germany.

http://images.google.com/imgres?imgurl=http://www.lib.utexas.edu/maps/europe/west_germany_ind_1972.jpg&imgrefurl=http://mapanalysisnoles949.blogspot.com/2008/06/continuously-variable-proportional.html&usg=__C11P3mZOyeGNRV9SpdWnWptLQSM=&h=1088&w=762&sz=208&hl=en&start=1&um=1&itbs=1&tbnid=gcVPI-fj1PL89M:&tbnh=150&tbnw=105&prev=/images%3Fq%3DContinuously%2BVariable%2BProportional%2BCircle%2BMap%26um%3D1%26hl%3Den%26client%3Dsafari%26sa%3DN%26rls%3Den%26tbs%3Disch:1

Range Graded Proportional Circle Map


A range graded proportional circle map is a proportional circle map that depicts the circles in relation to ranges of data. This range graded proportional circle map above shows different locations in relation to one another.

http://images.google.com/imgres?imgurl=http://4.bp.blogspot.com/_b_Fy-HKi1ks/STfcbpmgJAI/AAAAAAAAAHw/dEpRC6_r0ko/s320/Range_graded_proportional_circle_map.gif&imgrefurl=http://bpxf20map.blogspot.com/2008_12_01_archive.html&usg=__0mGP8JXqfcw3wK__rS1wYjE8lC8=&h=192&w=320&sz=92&hl=en&start=4&um=1&itbs=1&tbnid=kPO4XwWSPG0QUM:&tbnh=71&tbnw=118&prev=/images%3Fq%3Drange%2Bgraded%2Bproportional%2Bcircle%2Bmap%26um%3D1%26hl%3Den%26client%3Dsafari%26sa%3DN%26rls%3Den%26tbs%3Disch:1

Classed Choropleth Maps


In a classed choropleth maps the main objective is to determine height and shading or color intensity of the bar for each map classed. This involves creating a classed frequency legend including a frequency histogram and shading. As seen in the classed choropleth map above it compares the amounts of hispanics and latinos is Florida. After looking at the data they came to conclusion that most hispanics and latinos live in southern florida.


http://images.google.com/imgres?imgurl=https://blogger.googleusercontent.com/img/b/R29vZ2xl/AVvXsEjMeAbzckMfx_vBcHVMqZPQAejVlYQWhCUosJ0cESscFTRxR4E5dePAjsgO4TFrA-3dBFkT5DUiM8PJ-rQloocFg4plHc_uOj_bSXRSPe5Hs3bTCuNULUrn9EXYmvV059a5HOqdYKw_Kak/s320/classed+choropleth+map.gif&imgrefurl=http://mavance2000.blogspot.com/2008/07/classed-choropleth-map.html&usg=__0rFgtG2hjlZ2rqilp86uSPKaxAU=&h=240&w=320&sz=72&hl=en&start=2&um=1&itbs=1&tbnid=ay-cD1KL1dxxdM:&tbnh=89&tbnw=118&prev=/images%3Fq%3Dclassed%2BChoropleth%2BMaps%26um%3D1%26hl%3Den%26client%3Dsafari%26sa%3DN%26rls%3Den%26tbs%3Disch:1